The latest month of the index, step by step
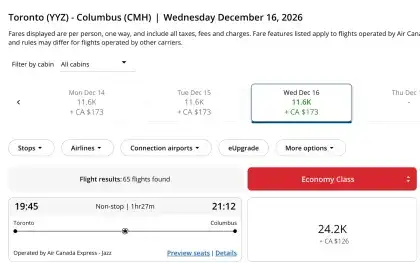
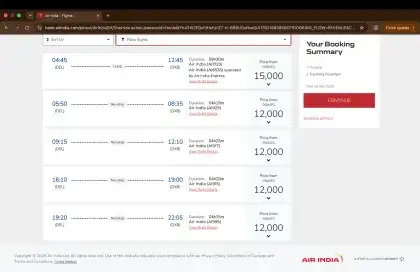
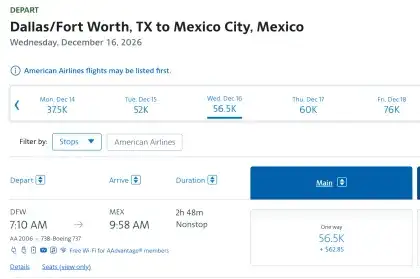
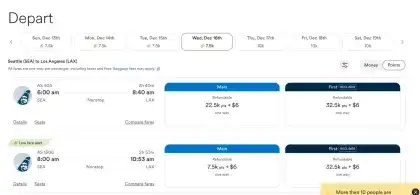
The index has three months of prices so far, from August to October 2026, and each new month adds one step. Scroll down to walk through the latest: each dot is a trip I priced in September and again in October. Watch what happened to the price in points, the price in cash, and what a point was worth.
Each dot is one trip I priced twice: the same flight or hotel night, booked the same number of days ahead, in September and again in October.
Blue dots are flights. Green dots are hotel nights.
Each dot moves left if the trip cost fewer points in October, right if it cost more. The white line is the overall average.
Overall, trips cost 20.3% more points.
The same trips, priced in cash on the same search, converted to US dollars on the day.
Overall, cash prices rose 7.9%.
Divide the cash price by the points price and you get what one point is worth. Red: a point bought less. Blue: it bought more.
Overall a point bought 10.7% less. That one number, tracked month after month, is the index.
Chained onto the months before, a point now buys 7.6% less than in August, when the index began.
Airline points lost 12.8%. Hotel points lost 5.5%.
One average can hide two markets moving in opposite directions.